Speaking the Language of the C-Suite: Why ROI of AI-Powered Onboarding Matters
HR professionals generally understand well that the work of their department has a direct strategic impact on the overall success of the company. However, not all of them are able to convey this understanding to senior management. For top management to start perceiving HR not as a support function but as one of the key areas of business, it is necessary to speak the language of the C-suite: the language of concrete data, metrics, and return on investment (ROI) expressed in numbers and percentages.
To demonstrate that investments in an AI-powered onboarding platform are not just operating expenses but a strategic decision, a convincing business case must be prepared. To secure budget approval and validate the value of their initiatives, HR leaders need to translate improvements in new-hire onboarding processes into tangible financial and business metrics. In this form, information is most likely to resonate with CEOs, CFOs, and other executives.
Calculating the ROI of AI onboarding moves the conversation from “We think this will improve and accelerate the onboarding process for new employees” to “As a result of implementing AI-based solutions, we predict an increase in employee retention by X%, which will save the company $Y in recruitment and training costs”. This data-driven approach positions HR as a strategic driver of profitability and efficiency. It proves that optimizing the first 90 days of employment with AI is directly linked to the company’s long-term financial health and deserves significant investment.
The Hidden Costs You're Already Paying: Calculating the Financial Losses of Ineffective Employee Onboarding
Before calculating the potential benefits of a new system, it is important to quantify both the existing and potential losses caused by the current process. Many business leaders do not realize that they are already paying a high price for ineffective new employee onboarding. This “cost of inaction” is a powerful argument in any business case. It forces companies to rethink their investment strategy as a necessary measure to prevent ongoing systemic financial losses.
The Revolving Door: Quantifying Early-Stage Turnover Costs
High turnover among new employees is the most visible negative indicator of ineffective onboarding. Research shows that a significant portion of new hires leave within just a few months of being hired. In fact, up to 20% of all employee turnover occurs within the first 45 days. This leads to substantial financial losses. According to the Society for Human Resource Management (SHRM), the cost of replacing an employee can range from 90% to 200% of their annual salary.
These costs can be calculated using a simple formula:
Annual Turnover Cost=(Number of New Hires Annually)×(Early Attrition Rate%)×(Average Cost to Replace an Employee)
Example: for a company hiring 100 people per year, with a 15% turnover rate in the first six months and an average replacement cost of $50,000, the annual losses amount to $750,000. These are direct, quantifiable losses that can be significantly reduced through an effective AI onboarding system.
The Productivity Gap: The Price of a Slow Ramp-Up
“Time to Full Productivity” is the period during which a new employee becomes a fully contributing member of the team. According to a Gallup report, traditional onboarding can stretch this period to as long as 12 months. During this entire time, the company pays a full or nearly full salary while receiving only partial value. Onboarding supported by artificial intelligence (with its personalized and adaptive learning modules) can reduce the “time to full productivity” to just 40% of the original period.
To quantify this, calculate the value of the days saved:
Productivity Gain per Hire (Average Daily Value of Employee)×(Number of Days Saved in Increased Productivity Time)
Example: If an employee is worth $500 per day and AI saves 20 days of the adaptation period, then the productivity gain would be $10,000 for that single hire.
The Engagement Deficit: How Poor Onboarding Fuels Disengagement
An ineffective onboarding process for new employees is one of the main causes of low engagement within the team. A Gallup study shows that only 12% of employees believe their organization effectively integrates new hires. This is a critical issue, as employees who do not feel part of the team are less productive, less innovative, and more likely to leave. Losses associated with decreased productivity due to low engagement are estimated at approximately 18% of an employee’s annual salary.
Thus, investing in AI-powered onboarding is also an investment in building a productive and loyal workforce, where each team member is actively engaged in the life of the company from day one.
What to Measure? Identifying Your Key Metrics
To build a compelling business case, it is first necessary to define what exactly should be measured and analyzed. The most effective way to clearly demonstrate the impact of AI in onboarding is to track a balanced set of Key Performance Indicators (KPIs). These indicators can be divided into two main categories: Hard ROI and Soft ROI.
- Hard ROI refers to tangible, easily quantifiable financial metrics. These are the data points that directly affect net profit, such as cost savings and efficiency gains.
- Soft ROI refers to less tangible but equally valuable metrics related to employee experience and engagement. While they are more difficult to express directly in monetary terms, they serve as leading indicators of Hard ROI.
A measurement system that incorporates both categories provides a holistic view of how AI-driven onboarding impacts cost savings as well as improvements in employee skills, experience, and engagement.

Hard ROI Metrics (Financial & Efficiency)
Hard ROI is the foundation of your business case. These metrics represent the most obvious and well-substantiated financial benefits of implementing AI onboarding solutions. When presented to executives, they are the first numbers to capture top management’s attention and justify the investment.
- Cost Savings. This is the most straightforward and easy-to-measure indicator. It includes reductions in HR and managers’ workload, savings on materials (printing, mailing), and, most importantly, lower costs associated with employee turnover. Research shows that AI helps HR professionals save an average of 14–20 hours per week. For the organization as a whole, this can translate into more than $18,000 in annual savings through automation.
- Time-to-Productivity. This metric reflects how quickly a new hire becomes a fully contributing team member. Leveraging AI in onboarding can reduce this period by up to 40%, meaning the company begins to receive the expected return from new employees more quickly, directly impacting revenue and project delivery timelines.
- New Hire Retention Rate. This is perhaps one of the most compelling indicators of ROI in AI-driven onboarding. The cost of replacing an employee can range from 90% to 200% of their annual salary. Therefore, even a one-percentage-point increase in retention can result in significant savings. Effective onboarding powered by AI can help organizations improve new-hire retention rates to as high as 82%, translating directly into substantial financial benefits.
Soft ROI Metrics (Experience & Engagement)
Soft ROI metrics reflect the impact of AI implementation on the experience, skills, and engagement of new employees. While they are difficult to express in monetary terms, they play a key role in demonstrating the effectiveness of onboarding programs and serve as reliable leading indicators of future Hard ROI metrics such as retention and productivity.
- New Hire Satisfaction (eNPS). Measuring employee loyalty scores at 30, 60, and 90 days provides clear insights into overall satisfaction. Regular surveys make it possible to track how new hires evaluate their experience in the company. Employees who go through AI-powered onboarding report high levels of satisfaction, with 85% stating their experience was positive.
- Engagement Metrics. AI tools can track engagement in several ways – through sentiment analysis in feedback or by tracking direct interaction with onboarding materials. For example, Pitch Avatar provides detailed analytics on content engagement. Reports show which new employee viewed onboarding presentations, how much time they spent on each slide, and what questions they asked the AI Chat-Avatar. This provides a concrete, quantifiable metric that directly measures the level of new-hire engagement.
- Onboarding Completion Rates. This is a simple but effective indicator, based on the number of completed training modules and assigned tasks during onboarding. A high completion rate indicates that the process is clear, engaging, and effective, while low completion rates help identify areas for improvement in the AI-powered onboarding process.
How Specific AI Features Deliver Measurable ROI
Understanding how AI produces positive results helps build compelling arguments. It’s not magic – it’s a suite of specific technologies designed to solve some onboarding challenges.
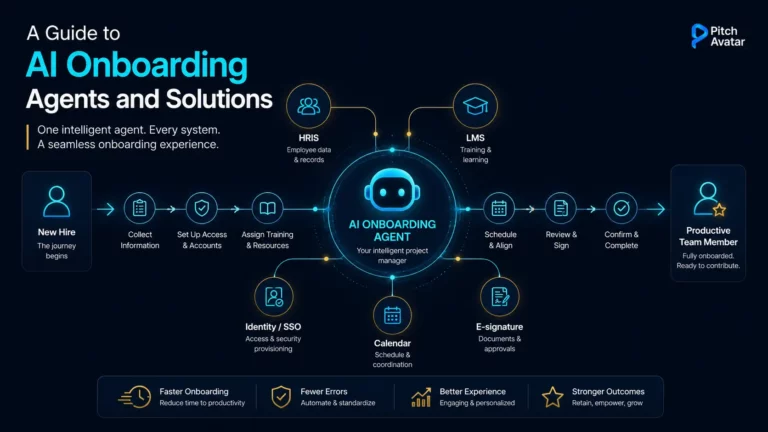
- Automation & Workflow Management. At its core, AI automates repetitive, manual tasks that consume HR and managers’ time. This includes sending documents, assigning training modules, scheduling check-ins, sending reminders, and more. The direct return on investment is reflected in a massive reduction of manual administrative hours and higher onboarding completion rates.
- AI-Powered Chatbots & Virtual Assistants. New employees often have numerous questions related to the company and its work processes. A customized and trained AI assistant can provide 24/7 answers to common “new hire questions” about corporate policies, tool access, job responsibilities, software and equipment setup, benefits, and more. The ROI of such solutions comes from freeing managers and the HR team from having to constantly “satisfy the curiosity” of newcomers. At the same time, new hires feel more confident when asking AI, avoiding the awkwardness often associated with these situations.
- Personalized & Adaptive Learning. In this area, AI has become a game-changing strategic factor. It can analyse a new employee’s data and skills – not only based on resumes and pre-employment assessments, but also through the questions they ask. By aligning this information with job responsibilities, AI can create personalized training plans and materials. This directly shortens the time to full productivity and improves engagement levels.
- Advanced Analytics & Sentiment Analysis. Modern AI platforms provide sophisticated dashboards that go beyond basic reports on module and task completion. They can analyse feedback and survey results to detect sentiment trends and identify problem areas in the onboarding process. This enables the expression of Soft ROI in measurable metrics and establishes a cycle of continuous improvement. Such capabilities are available through platforms offering advanced onboarding analytics.
How to Calculate ROI: A Simple Framework
Once you have identified your metrics and gathered your baseline data, you can calculate ROI using a standard formula. This framework breaks the calculation down into simple, manageable steps, demystifying the process for HR professionals who may not have a financial background.
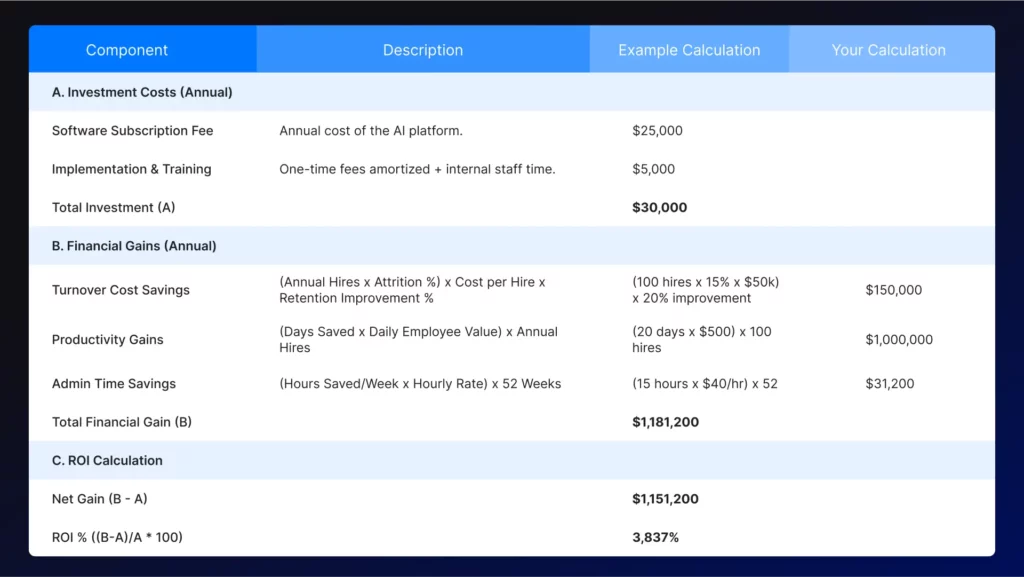
Step 1: Calculate Total Investment Cost
This is the foundational step where you quantify the total cost of ownership (TCO) for the AI onboarding solution over a specific period, typically one year. It’s crucial to be comprehensive and include both direct and indirect costs to establish an accurate financial baseline.
Formula: Total Investment Cost = (Annual Software Fees) + (One-Time Implementation & Integration Costs) + (Internal Staff Time Costs)
- Annual Software Fees: This is the most straightforward component — the subscription or licensing cost for the AI platform.
- One-Time Implementation & Integration Costs: Include any fees for setup, configuration, customization, and integration with your existing systems, like an HRIS. If these are one-time costs, you can amortize them over the expected life of the software for a multi-year ROI calculation.
- Internal Staff Time Costs: This “hidden” cost is critical. Calculate the hours your HR team and managers will spend on training, change management, and learning the new system, then multiply those hours by their average hourly wage.
Step 2: Quantify Financial Gains
In this step, you will sum the dollar value of all your hard ROI metrics over the same period. This represents the total financial benefit or “return” generated by the investment.
Formula: Total Financial Gain = (Savings from Reduced Turnover) + (Value of Accelerated Productivity) + (Cost Savings from Administrative Automation)
- Savings from Reduced Turnover: This is often the largest financial gain. First, calculate your current turnover cost, then apply your projected improvement.
- Formula: Turnover Savings = (Annual Hires × Current Attrition Rate % × Avg. Cost per Replacement) × Projected Retention Improvement %
- Value of Accelerated Productivity: This quantifies the value of new hires becoming fully contributing team members faster/
- Formula: Productivity Gain = (Days Saved in Ramp-Up × Avg. Daily Employee Value) × Number of Annual Hires
- Note: Calculate “Avg. Daily Employee Value” by dividing an employee’s annual salary plus benefits by the number of working days in a year.
- Cost Savings from Administrative Automation: This captures the efficiency gains from automating manual onboarding tasks.
- Formula: Admin Savings = (Hours Saved per Week × Avg. Hourly Wage for Admin Staff) × 52 Weeks
Step 3: Apply the ROI Formula
Finally, plug your total investment and total gain into the standard ROI formula to calculate your return as a percentage.
Formula:
ROI (%) = ((Total Financial Gain − Total Investment Cost) / Total Investment Cost) × 100
The resulting percentage shows the return for every dollar invested. For example, an ROI of 50% means that for every dollar you spend, you get $1.50 in value. In many cases, companies can see a positive ROI within 6–12 months, driven primarily by immediate administrative savings and improved retention in the critical first year of employment.
Building Your Business Case
Presenting your findings effectively is just as important as the calculation itself. To help you communicate your business case to leadership, it’s best to structure your proposal in a clear, logical format that executives can quickly understand. A slide presentation or a two-page summary is an invaluable asset.
Your presentation should include the following sections:
- The Problem: Briefly outline the current challenges with your manual onboarding process, using your baseline metrics on retention, time-to-productivity, and HR workload.
- The Proposed Solution: Introduce the AI-powered onboarding strategy and the specific platform you recommend.
- Investment Costs: Clearly itemize the software, implementation, and internal costs.
- Projected Benefits & ROI: Present your hard and soft ROI metrics, culminating in the final projected ROI percentage you calculated. Use visuals and charts to make the data compelling.
- Implementation Plan & Timeline: Provide a high-level overview of the implementation process, including key milestones and a realistic timeline.
- Measurement & Success: Explain how you will continue to track the key metrics post-implementation to prove the value delivered.
Frequently Asked Questions (FAQ)
Hard ROI refers to easily quantifiable financial metrics that can be directly translated into dollar values. Examples include cost savings from reduced administrative hours, lower recruitment expenses due to better retention, and increased revenue from faster employee productivity. Soft ROI refers to less tangible but still critically important metrics like employee satisfaction, engagement scores, and improvements in company culture. While it is harder to assign a specific amount, a strong soft ROI is a leading indicator of a strong hard ROI.
You can create a credible estimate for this value. First, calculate the average daily value of an employee in a specific role. A simple way is to take their annual salary plus benefits and divide it by the number of working days. A more advanced method involves factoring in the revenue they generate or contribute to. Once you have this daily value, multiply it by the number of days saved by the more efficient AI onboarding process. For example, if an employee’s value is $500/day and AI saves 10 days of ramp-up time, the productivity gain is $5,000 for that single hire.
This is a common challenge. The best approach is to start with a foundational audit. Before implementing any new technology, benchmark your current process. Audit existing materials, survey recent hires and their managers to identify pain points, and gather whatever baseline data you can on retention and time-to-competency for a specific department. This creates the starting point against which you can measure improvement, even if it’s not perfect.