What the data says about how AI is actually used to create and deliver presentations – and where it is still not effective.
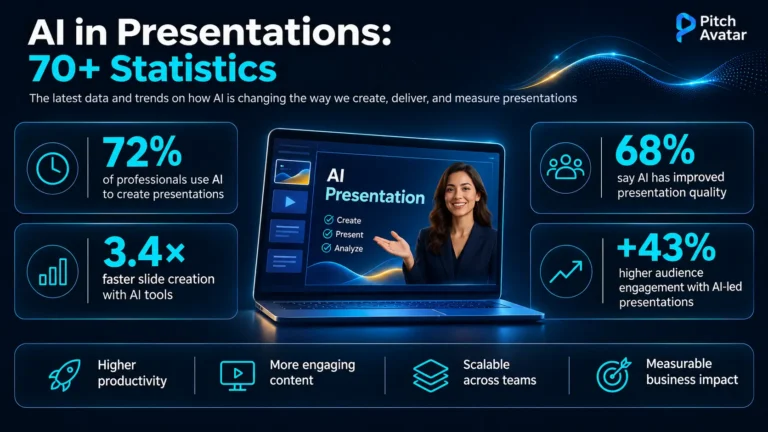
TL;DR: AI is now used in presentation tasks almost everywhere, though its adoption varies. About 80% of professionals currently use AI at some point in their presentation process, and 77% expect to use it more over the next year, yet satisfaction decreases sharply as tasks become more difficult: fewer than 30% are happy with AI on complex presentation work, only 22% for charts, and just 14% for presentations created completely from scratch. All the data below shows the same trend: AI excels at writing and improving text, can generate a first draft almost instantly (in about 22 seconds), but struggles with tasks that need human judgment, such as complex data visualization, creating a storyline, and design. The market is expanding as a result, from $1.94 billion in 2025 to an estimated $6 billion by 2030. And the reality of productivity is more realistic than the marketing suggests: workers report saving about six hours a week with AI but also spending roughly four hours correcting its output (SHRM), so the net benefit is much smaller than vendor figures indicate. The practical advice is to use AI for initial drafts and not for the finished presentation.
Artificial intelligence has moved into presentation work faster than almost any other office task. The real question is no longer if people use it, but what purpose it serves for them – and where it stops being useful. Here is what the current data reveals.
Key Numbers at a Glance
| Metric | Figure | Source |
|---|---|---|
| AI presentation generation market (2026) | $2.43B, an increase from $1.94B in 2025 | The Business Research Company |
| Projected market size (2030) | $6B at 25.3% CAGR | The Business Research Company |
| Global AI market (2030 projection) | $1.81 trillion with a 37.3% CAGR | Grand View Research |
| Professionals using AI in presentation workflow | ~80% | think-cell (1,200 pros, 12 countries) |
| Expect to increase AI usage within 12 months | 77% | think-cell |
| Regular AI use, US and Canada | 44% | think-cell |
| Satisfied with AI on complex tasks | under 30% | think-cell |
| Already build presentations with AI | 27% | think-cell |
| Average generation time using AI | ~22 seconds | 2Slides |
| Median editing time after generation | ~14 minutes | 2Slides |
| Students using generative AI weekly | 86.80% | Social Sciences & Humanities Open |
| Employees reporting a positive productivity effect from AI for presentations | 76% (2nd of all AI uses) | Gallup, Q2 2026 |
| Hours saved per week vs. hours spent correcting AI output | 6 saved, 4 fixing | SHRM, 2026 |
| Share of work hours saved by generative AI users | 5.4% (~2.2 hrs/week) | St. Louis Fed |
| Organizational AI adoption, all functions | 88% | Stanford AI Index 2026 |
The Market: How Big and How Fast

This market segment is small compared to the wider presentation software industry, but niche is expanding rapidly.
- The Business Research Company predicts the global market for AI presentation tools will reach $2.43 billion in 2026.
- This represents an increase from $1.94 billion in 2025 and $1.54 billion in 2024.
- The year-over-year growth rate into 2026 was 25.6%.
- The forecast projects the market will grow to $6 billion by 2030, with a compound annual growth rate of 25.3%.

For context, the overall AI market is much larger. Grand View Research reported that global AI revenue was $196.6 billion in 2023. It is expected to hit $1.81 trillion by 2030, growing at a 37.3% compound annual growth rate. Software makes up the biggest part of this, with a 35.83% revenue share, and North America accounts for 30.9% of global revenue.
In short, presentation generation is a fast-growing niche within an even faster-growing industry, which often signals a feature becoming its own product category.
The direction, not a single number
Most reports provide only one year’s figures. Trend lines are more informative because they show whether growth is accelerating or slowing down.
| Measure | Earlier | Latest | Direction |
|---|---|---|---|
| AI presentation market | $1.54B (2024) | $2.43B (2026) | +58% in two years |
| Year-on-year market growth | 26.0% (2024-25) | 25.3% (2025-26) | Steady, not accelerating |
| Share of all US work hours saved by AI | 1.6% (Q3 2024) | 2.2% (Q2 2026) | +0.6 points in under two years |
| B2B buyers preferring a rep-free experience | 61% (2025) | 67% (2026) | +6 points in one year |
| Organizational AI adoption, all functions | 55% (2024) | 88% (2026) | +33 points in two years |
Two points are worth noting. First, market growth remains stable rather than accelerating, remaining at around 25-26% per year. This suggests that this category of technologies is strengthening its position and is not turning into a “bubble”. Second, the measurable productivity benefits are still minor overall. Generative AI accounts for only 2.2% of all saved work hours in the US, even after three years of use. Public excitement is far outpacing the actual economic impact, and this difference provides the most crucial context for every other figure presented in this article.
Adoption: Nearly Everyone, But Not Equally

- 80% already use AI at some stage of their presentation workflow.
- Usage rates are nearly identical across regions: 80.3% in North America, 79.2% in Europe.
- 77% expect to increase their AI usage over the next 12 months.
Regular use tells a different story from simply trying AI:
- 44% of professionals in the US and Canada use AI regularly when creating presentations.
- this drops to 29% in the five European countries surveyed (Denmark, France, Germany, Sweden, and the UK)
This suggests the real difference is not whether people have experimented with AI, but whether it has become a regular part of their routine.
Workplace surveys from various sources provide insight on how creating presentations with AI compares to other AI-driven activities. Gallup has been tracking this specific question quarterly since 2023, reporting that overall AI adoption in the workplace reached 52% by Q2 2026. Of these users, 30% use AI frequently, and 15% use it daily. SHRM’s March-April 2026 survey of 5,875 US workers found that 17% of AI users use it specifically to create presentations or slides.
The ranking of presentations for perceived usefulness stands out. Gallup’s Q2 2026 figures show that 76% of workers reported a positive impact on their productivity when using AI for presentations creation. This made it the second most effective AI use case, behind only coding assistance at 77%, and ahead of data science, writing, and research. Whatever its limits, this is one of the tasks people find AI most useful for. This aligns with the broader business landscape: the Stanford AI Index indicates that 88% of organizations adopted AI across all business functions in 2026, with generative AI actively used in at least one function by 70% of companies. Meanwhile, fully autonomous AI agents remained below 10%. AI became commonly used for presentation work first because the task involves a lot of text, is repetitive, and carries little risk for experimentation.
The Satisfaction Gap: What Is AI Really Good At?

This finding stands out as the most practical in the entire dataset, and it likely matches your experience. While many people use AI, satisfaction levels decline as tasks become more complex.
- 44% use AI to review and improve presentation content – the single most common use, and the one where people report the highest satisfaction.
- Fewer than 30% are happy with AI for complex presentation tasks like creating charts.
- In Europe, only 22% are satisfied with AI for making and editing charts.
- Just 14% are satisfied with presentations generated entirely from scratch.
- Yet 27% already create entire presentations with AI from scratch.
Workflow Mechanics: Speed, Editing and Prompts

- Average generation time: ~22 seconds.
- Median: 19 seconds.
- 95% of presentations generated in under 30 seconds.
Editing takes the most time:
- Median editing time after generation: around 14 minutes.
- 78% of users finished their projects with fewer than three edits.
- 62% edited text, 34% reordered slides, 28% replaced images.
- Only 3% of users completely restarted the generation process.
Detailed prompts bring significant benefits:
- Presentations created from prompts of 50 words or more received 31% higher quality scores than those made from prompts under 15 words.
- Spending about 30 extra seconds to write a more complete prompt saved an estimated 15 to 20 minutes in editing time.
A caveat that important for this section: these figures come from the internal analytics of AI presentation platforms, not independent research, and those companies have a commercial interest in positive numbers. The directional pattern – generation in seconds, refinement in minutes – matches common experience, but read the specific percentages as indicative.
The general trend (content generated in seconds and refined in minutes) is consistent with common practice, but specific percentages should be viewed as general indicators only.
What Does AI Actually Save and What Does It Cost?
Time savings is the most-quoted and least-reliable number in this entire category. It is important to distinguish between what vendors report and what independent researchers measure.
What the platforms report:
- Average reported saving among 550 active users in Beautiful.ai’s November 2025 in-product survey: 5.6 hours per week, with a median of 3 hours.
- 58% reported saving at least three hours per week.
- For sales and marketing professionals, this average increased to ~8 hours weekly. HR, finance, and creative roles reported 6+ hours
- Beautiful.ai estimates it saves its more than 100,000 paying customers 15 million hours each year, a value it places at over $1 billion. The company arrives at this figure using a specific formula: median hours saved per week x 4.3 weeks x hourly cost x 12 months (This figure should be treated with caution, as it generalizes the results of the company’s own subscriber survey to the entire economy).
What independent research finds:
- The St. Louis Fed discovered that generative AI users save 5.4% of their work hours (roughly 2.2 hours a week) and that AI saved 2.2% of all US work hours in Q2 2026, an increase from 1.6% in Q3 2024.
- The European Central Bank found a typical euro-area user saves 3 hours a week, about 7.7% of their average working time, with 90% of AI users saying the tools save them time. Because only 48.8% of euro-area workers both use AI and experience time savings, the ECB estimates the overall economic efficiency gain to be closer to 3.8%.
- SHRM indicated that the average AI user saves about 6 hours a week – and spends about 4 hours a week correcting AI output. The ratio varies by seniority: directors and those in higher positions reported saving 9 hours while spending 6 hours on corrections, while individual contributors reported saving 4 hours and spending 3 hours on corrections.
That last figure is rarely mentioned, and it is the most important number in this article. The real time savings are about two hours a week, not the six or eight hours often promoted. This also clearly explains why users are not satisfied: AI not only struggles with difficult tasks, it also creates additional work that can be measured.
Some balancing points to consider:
- A METR randomized controlled trial (July 2025, involving 16 developers, 246 real tasks) showed that experienced developers worked 19% slower when using AI tools, even though they expected a 24% increase in speed. To be fair, METR later stated that this particular metric was outdated, suggesting that speed improvements are now probable and that changes in developer behavior have made their subsequent results unreliable. The most important discovery isn’t the 19% figure itself, but the difference between what the developers believed and what their actual working hours showed.
- PwC’s 29th Annual Global CEO Survey found 56% of companies report getting nothing from their AI initiatives.
- Microsoft’s Work Trend Index (May 2026, 20,000 knowledge workers across 10 countries) found 58% of AI users produce work they could not have done a year earlier, and 49% of AI-assisted work now supports critical tasks such as analysis and problem solving.
- Deloitte reports leading companies now provide access to AI tools to more than 80% of their employees, with access growing 50% in a single year – yet less than 60% of employees who have access actually use the tools in their daily work.
Taken together, these findings show that AI truly saves time on presentations. People genuinely consider it one of their most helpful applications. The real net benefit is only a couple of hours a week rather than a transformed work week.
The Actual Value, After Subtracting Rework
Every roundup in this category mentions hours saved. Almost none converts it to money, and none account for the hours spent correcting AI output. Here is the calculation, using measured figures rather than advertised ones.
Taking a 48-week working year:
| Basis | Hours saved per year | Value at $50/hr | Value at $100/hr |
|---|---|---|---|
| Gross saving (6 hrs/week, SHRM) | 288 | $14,400 | $28,800 |
| Net of rework (2 hrs/week, SHRM) | 96 | $4,800 | $9,600 |
| ECB median (3 hrs/week) | 144 | $7,200 | $14,400 |
| St. Louis Fed (2.2 hrs/week) | ~106 | $5,280 | $10,560 |
The difference between the initial AI output and the corrected version is the whole point. Correcting AI output removes about two-thirds of the total time savings – 288 hours a year becomes 96. Published claims in this category commonly cite around 180 saved hours and $9,000 a year per user at a $50 hourly rate. The actual number, once rework is accounted for, is closer to 96 hours and $4,800 at the same rate.
This outcome still brings a real benefit. Saving a few hours each week (when multiplied across a team) is valuable, and it’s worth paying for a subscription instead of hiring new employees. But that’s about half of what is usually promised in advertising for products in this category. Any business proposal based on the higher, unadjusted figure will likely disappoint the person who approved it.
The practical conclusion is specific: the highest-return optimization is not generating or creating faster, it is reducing rework. That is why the prompt-detail finding above is so important – 30 extra seconds of instruction saving 15 to 20 minutes of editing directly addresses the cost that otherwise consumes the benefit.
From Blank Page to Collaborator: How Usage is
Gamma’s Creation Index, which uses anonymous aggregated data from billions of sessions through May 2026, captures a change that more significant than any single adoption rate.
- In Q1 2025, 59% of creations started from scratch. By Q1 2026, that had dropped to 31%.
- During the same period, creations that started from a user’s own notes, documents, decks, or transcripts increased by 68%.
- AI-generated images appear in 79.6% of all creations, while stock photography makes up less than 2%.
- Users created 1.31 billion images on the platform in 2025, 63.4% of them narrative illustration.
- The top 1% of creators, identified in the report as “supercreators”, are responsible for 11% of all content made on the platform.
The first two data points tell a clear story. Within a year, creating content from a blank prompt became less common, while using AI with existing user material increased by two-thirds. This shift reflects a satisfaction gap playing out in user behavior: people first tried AI to generate content, found the results lacking, and then began using it as an assistant with their own information (This information comes from vendor platform data and should be understood as such. But the data describes actual usage rather than promoting the platform).
Education: The Hybrid Workflow is Already Standard
Peer-reviewed research offer a clearer view of actual behavior. A 2026 study published in Social Sciences & Humanities Open observed 53 architecture students completing a real course assignment requiring a presentation.
- 86.8% already used generative AI at least once a week.
- 73.6% said AI created no more than half of their presentation content.
- Time-saving effect rated at 4.15 out of 5.
- Usefulness for process efficiency: 3.99 out of 5.
- Usefulness for organizing information and structuring slides: 4.02 out of 5.
The 73.6% figure holds more significance than the adoption rate. It shows that even frequent users relied on AI for only a portion of their work and not all of it. This points to a hybrid workflow where the student still controls the final output. While the ratings are strong, they don’t represent perfect scores. This aligns with the professional satisfaction data mentioned earlier. (The study involved a small sample of 53 participants, so consider its findings as an indication of general trends rather than precise measurements.)
Sales Presentations: Where the Stakes are Highest
- 83% say AI already plays an important or key role in building and personalizing sales presentations.
- 91% reported an increase in their sales close rates.
- 87% say that AI adoption is happening faster than regulation, and 75% report that salespeople frequently use public AI tools in ways that don’t align with brand guidelines.
Independent sources confirm the general trend: Gartner reports that 67% of B2B buyers now prefer to buy without a sales representative, and 74% of B2B buying teams face unhealthy internal disagreements during the decision process. When a presentation must sell to a committee that already struggles to agree, personalizing it at scale becomes essential, not just a nice-to-have
How Audiences Actually Consume Presentations
It’s useful to compare these production data with what we know about how people actually process information, as it explains why AI satisfaction levels show up where they do:
- 79% of users always scan a new page rather than reading word by word; only 16% read thoroughly (Nielsen Norman Group).
- 63% of people prefer a short video to learn about a product or service, compared with 12% who prefer a text article (Wyzowl, 2026).
- Viewers watching subtitled video with the sound off experience a higher cognitive load, and their understanding, engagement, and enjoyment decrease (peer-reviewed eye-tracking research).
Audiences typically skim text, prefer video content, and struggle when asked to read and watch at once. That is precisely the territory where generated text is cheap and good decisions about how to structure content and use visuals are expensive.
Why These Numbers Disagree With Each Other
Anyone who reads several pieces on this topic will see that the statistics do not match up. It is important to explain these discrepancies instead of ignoring them, as the differences provide valuable information and are usually not mistakes.
| Question | Published answers in circulation |
|---|---|
| Organizational AI adoption | 47% (employees saying their org has integrated AI, Gallup) vs 88% (organizations reporting AI use, Stanford AI Index) |
| Adoption rate | 80% (use AI somewhere in presentation workflow) vs ~62% (enterprise deployment) vs 52% (any AI use at work) |
| Time to produce a deck | 22 seconds (generation only) vs ~12 minutes (prompt to export) vs 38 minutes (total human time) |
| Weekly time saved | 5.6 hrs (vendor survey) vs 3 hrs (ECB) vs 2.2 hrs (St. Louis Fed) vs ~2 hrs net (SHRM, after rework) |
Almost all the differences in results are explained by four factors:
- The same word means different things. “Adoption” might mean tried once, used weekly, or company-wide deployment – three groups that differ by 30 points. “Creation time” could mean model generation, prompt to export process, or total human time spent, including editing – three numbers that differ by two orders of magnitude. Most apparent contradictions disappear when the definitions are clarified.
- Who provided the information. A platform surveying its own paying customers is polling individuals who already chose the tool and like it. In contrast, a national labour market survey covers everyone, including those who are unconvinced. This self-selection process explains a large part of the difference between data from vendors and independent sources.
- Actual measurement versus self-reported data. Asking someone how much time they saved produces a different answer than measuring it. The METR trial is the clearest demonstration: developers believed AI made them faster while measurement showed them slower – a 39-point difference between what was perceived and what the clock recorded.
- Who benefits from the answer. Market size estimates published by companies that sell their products in it are usually overstated; performance gains claimed by productivity solution providers are typically quite high. This doesn’t necessarily indicate unfairness (the boundaries of market categories can indeed be contested), but the incentives are skewed in one direction.
How to read any statistic in this category: always check the definition, the sample group, whether the data was measured or reported, and the publisher. When these four details are consistent across various independent sources, such as with the approximately 25% yearly market growth, the number is likely accurate. If they differ, trust measured data over surveys, and prefer independent publishers over those with a vested interest.
What This Means for Your Presentations
When looking at all the data sets together, it becomes clear that AI is good at quickly generating raw material, but it is not suitable for producing finished products. Teams successfully using AI develop, edit, localize, and adapt content at scale, then apply human judgment to its structure, data, and design.
That is the workflow Pitch Avatar is built around. It takes presentations you have already prepared (your slides, your main points, your data) and converts them into interactive video with AI avatars you can personalize for each recipient, localize into multiple languages, and track for engagement. You keep control over the judgment, while the repetitive tasks, localization, and distribution become automated. For more on delivery, refer to our guides on AI avatars and high-converting video CTAs.
About This Data
The statistics presented here originate from various sources with different levels of trustworthiness. We have cited each source appropriately.
Independent and peer-reviewed sources: The Business Research Company for AI presentation market size and growth; Grand View Research for the broader AI market; Social Sciences & Humanities Open (2026) for a student research project (we note its small participant group of 53 individuals); the Stanford AI Index 2026 for enterprise-wide AI adoption; Gallup (Q2 2026, quarterly since 2023) for workplace AI use and perceived productivity by task; SHRM (March-April 2026) for hours saved against hours spent correcting AI output; the Federal Reserve Bank of St. Louis and the European Central Bank for measured work-hour savings; METR and PwC (29th Annual Global CEO Survey, 4,454 CEOs across 95 countries) for counterweight findings; Microsoft’s Work Trend Index and Deloitte (State of AI in the Enterprise 2026, 3,235 leaders) for workplace access and usage; Gartner for B2B buyer behavior; Nielsen Norman Group for reading behavior; and Wyzowl for format preference.
Industry survey research: think-cell’s global survey of more than 1,200 professionals across 12 countries supplies the adoption and satisfaction figures. think-cell makes presentation software, so treat this as industry research rather than neutral academic work – though the methodology is stated and the sample is large.
Vendor platform data (directional only): Information on generation time, editing behavior, and prompt quality comes from 2Slides. Time savings figures from Beautiful.ai’s in-product survey of its own subscribers; usage-pattern data from Gamma’s Creation Index; and the sales presentation figures from DIGIDECK by TrendCandy. We report these trends because they are consistent and align with common experience, but the specific percentages should be seen as indicators, not facts.
Frequently Asked Questions
Around 80% use AI at some stage of their presentation workflow, per a global survey of 1,200 professionals across 12 countries – 80.3% in North America and 79.2% in Europe, with 77% plan to increase their AI use within a year. Regular use is lower and varies more: 44% in the US and Canada use it regularly, compared to 29% across the five European countries surveyed.
The Business Research Company estimates the global AI presentation generation market at $2.43 billion in 2026, up from $1.94 billion in 2025, and forecasts $6 billion by 2030 at a 25.3% CAGR. For context, Grand View Research projects the overall AI market reaching $1.81 trillion by 2030 at a 37.3% CAGR.
It depends entirely on the specific task. AI performs well on text-related work: drafting, rewriting, and refining text are its most common applications, and professionals are happiest with these results. Yet, it performs poorly on complex work – fewer than 30% are satisfied with AI on complex presentation tasks, only 22% on charts, and just 14% on presentations generated entirely from scratch. Use AI for initial drafts and not for the finished result.
Yes, substantially. Presentations created from prompts with 50 words or more scored 31% higher in quality compared to those from prompts under 15 words. Spending roughly 30 extra seconds writing a more complete prompt saved an estimated 15 to 20 minutes of editing time. This makes it the most efficient 30 seconds in the entire process.
Less than the marketing suggests, but the benefits are real. Vendor surveys report 5.6 hours a week; independent research is more conservative. The St. Louis Fed measured savings of 5.4% of work hours (about 2.2 hours weekly), the ECB reported a median savings of 3 hours, and SHRM discovered that workers save around 6 hours a week while spending about 4 hours correcting AI output – a net gain closer to two hours. The time spent on rework is a factor many reports overlook.
Yes, more than for nearly any other task. In Gallup’s Q2 2026 survey, 76% of employees reported a positive productivity effect from using AI for presentation creation – the second highest among all AI applications, just below coding assistance at 77%. SHRM found that 17% of workers who use AI at their job specifically apply it to making presentations.
Current evidence suggests it cannot. Satisfaction data reveals clear gaps precisely where designers add their greatest value: making complex charts, developing visual structure, and building entire decks from scratch. While AI handles the mechanical work (generating first drafts, variations, localization), humans retain control over structure, data accuracy, and design judgment.