
Our team at Pitch Avatar shares some of the most relevant and intriguing data we’ve come across – insights that help paint a clearer picture of the modern online customer profile.
We used data from primary reports (eMarketer, Eurostat, Baymard, Capital One Shopping, US Census Bureau) as sources. Market size and adoption figures are updated to 2026; behavioral survey data are presented for the latest published year, with the date indicated directly in the text, as several key surveys (such as the Eurostat survey) will release their next editions in 2027.
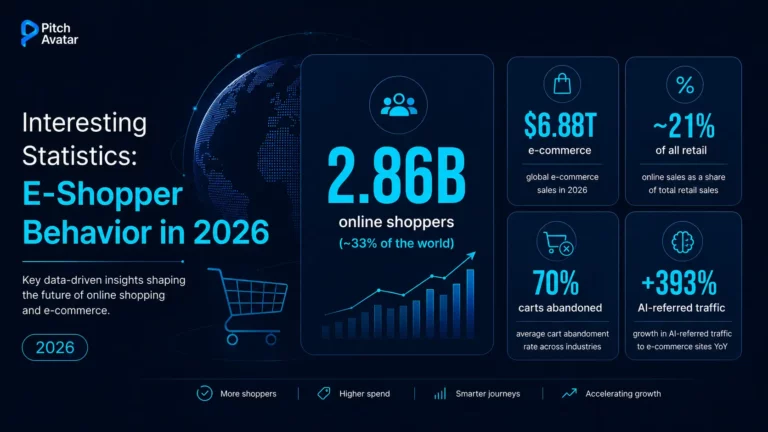
TL;DR: E-commerce continues to grow – by 2026, approximately 2.86 billion people (roughly a third of the planet) will shop online, e-commerce is predicted to make up about 21% of all retail sales worldwide, and mobile devices are now the primary tool for online sales. But problems remain: around 70% of carts are still abandoned (closer to 78% on mobile), and trust, checkout complexity, and delivery expectations are the main reasons shoppers leave. The 70+ statistics below describe the modern online customer – who they are, how they research, how much they spend, why they abandon purchases, and what inspires trust. Market-size data reflect 2026 projections; behavioral data are based on the most recently published survey data, dated directly in the text.
Key E-Shopper Numbers At a Glance
| Metric | Figure | Source |
|---|---|---|
| Online shoppers worldwide (2026) | ~2.86 billion (~33% of population) | Capital One Shopping |
| Global retail e-commerce sales (2026) | ~$6.88 trillion | eMarketer |
| E-commerce share of all retail sales (2026) | ~21.1% | eMarketer |
| EU internet users who bought online (2025) | 78% | Eurostat |
| Average cart abandonment rate | 70.22% | Baymard Institute |
| Average cart abandonment rate on mobile | ~78% | Dynamic Yield |
| Buyers who abandoned purchases due to a lack of trust (US) | 69% | eMarketer/Liquid Web |
| Recoverable orders via improved checkout process | ~$260 billion | Baymard Institute |
| Shoppers expecting checkout in ≤4 minutes | 66% | Capterra |
| Share of e-commerce sales from mobile (2025) | ~59% | Capital One Shopping |
| Rank free shipping as the top delivery criterion (US) | ~70% | Statista |
| AI-referred retail traffic growth (Q1 2026, YoY) | +393% | Adobe Analytics |
Size of The Online Shopping Market

- In 2026, approximately 2.86 billion consumers are shopping online, representing approximately one-third (33%) of the world’s population – an increase of approximately 3% from 2025. (Capital One Shopping).
- Global retail e-commerce sales are projected to reach about $6.88 trillion in 2026, up approximately 7% from 2025, as growth recovers somewhat after slowing in 2025 (eMarketer).
- E-commerce is expected to account for about 21.1% of all retail sales worldwide in 2026, up from 20.5% in 2025, and is projected to reach approximately 22.5% by 2028 (eMarketer).
- China is by far the largest market, with approximately 975 million online shoppers – about 83% of Chinese consumers (Capital One Shopping).
- In the United States, e-commerce reached about 18.3% of total retail sales as of Q4 2025, after a record ~$1.19 trillion in US online sales for the year – and it continues to grow faster than overall retail (US Census Bureau).
Who Shops Online

In developed countries, online shopping has become almost ubiquitous, and the demographic picture is changing: Generation Z is the fastest-growing group of shoppers, while older generations are the most stable and frequent shoppers.
Global and US:
- Worldwide, approximately 2.86 billion people (about a third of the global population) will shop online in 2026, and most future growth is expected to come from Gen Z as other generations approach market saturation (eMarketer).
- Gen Z is the fastest-growing group of digital buyers, and they’re more willing than previous generations to switch brands – making them the key acquisition target for the next few years (eMarketer).
- In the US, 73% of Gen Z consumers have made a purchase online within 12 months, and 34% say they prefer online shopping to in-store (Capital One Shopping).
- Millennials are the most dedicated online shoppers, making the majority of their purchases online approximately 14.3% more likely than any other generation (Capital One Shopping).
- Online shopping frequency is generally higher than expected: Gen X consumers are about 9.5% more likely than the average American to shop online on a weekly basis, and Baby Boomers are 8.4% more likely than other generations to shop online at least once a year (Capital One Shopping).
- Around 52% of online shoppers worldwide buy from foreign sellers, making cross-border shopping a mainstream rather than niche phenomenon (eMarketer/industry data).
Europe:
- In the EU, 78% of internet users bought or ordered goods or services online in 2025, up from 62% in 2015 (Eurostat).
- Online buying peaks in the 25-34 age group (90%), followed by 35-44 (87%) and 16-24 (84%). With age, this rate drops to 69% for people aged 55-64 years and to 55% for people aged 65-74 years (Eurostat).
- Employment and education shape the picture too: in 2025, 85% of workers shopped online compared to 60% of retirees, and 89% of those with higher education compared to 59% of those with less education (Eurostat).
- Online shopping has become a habit, not an occasional occurrence: in the EU, 62% of online buyers made a purchase within the last three months of being surveyed in 2025 (Eurostat).
- Only 15% of EU internet users have never made an online purchase in 2025 – online shopping has become the norm, not the exception (Eurostat).
How Shoppers Research Before Buying

- Most shoppers research before purchasing: The vast majority research a product online before visiting a store or placing an order, and search engines and online marketplaces are two of the main starting points for such research (Statista).
- Almost half of consumers prefer to start their product searches on online marketplaces rather than directly on brand or retail websites (Statista).
- Reviews are now part of the research process, and shoppers are increasingly checking a brand’s credibility beyond its own website before making a purchase. (eMarketer).
- Other users’ experiences matter more than brand messaging: 47% of social shoppers rely primarily on organic sources (customer reviews (26%) and recommendations from other users (21%)) versus 37% who rely on branded content (Bazaarvoice, Shopper Experience Index 2025).
- 57% of US adults start their product research on Amazon rather than a search engine or a brand’s website – making it the most common starting point for US shoppers (eMarketer).
- “Looking for reviews or ratings” is the single most common step (43%) shoppers take after finding a product or deciding to buy it (Bazaarvoice).
- The research channel itself is changing: among people aged 18–34, 41% now use generative AI tools to search for products instead of traditional search engines (Bazaarvoice, Shopper Experience Index 2025).
- The number of reviews itself is a trust signal: 39% of shoppers say the number of customer reviews significantly affects their confidence in a product (Bazaarvoice).
How AI Is Changing the Way People Shop

The latest change in e-shopper behavior is the arrival of AI assistants in the buying journey – and it’s happening faster than any other change in sales channels in recent memory. The database below uses US retail websites (where the data is most comprehensive), but the behavior is global.
- 39% of consumers have used AI for online shopping, and 85% of them say it improved their experience – with shoppers using it for product research (55%), recommendations (47%), and finding deals (43%) (Adobe Analytics survey of 5,000 consumers).
- AI-referred traffic to retail websites grew 393% year over year in Q1 2026, and is up approximately 14× since October 2024, when Adobe began tracking it – the fastest-growing traffic channel in e-commerce (Adobe Analytics).
- The quality of that traffic has changed: in March 2025, AI-referred visits converted 38% worse than through other channels; by March 2026 they converted 42% better – a complete reversal in twelve months (Adobe Analytics).
- AI-referred shoppers are the most engaged visitors many sellers have: they spend 53% more time on site and browse 23% more pages per visit than visitors from search, email, or social channels (Adobe Analytics, May 2026).
- Trust grows with usage: 79% of consumers using AI for shopping say they feel more confident in their purchases, and 66% believe AI tools provide accurate results (Adobe Analytics consumer survey).
- For those already using AI, it is becoming the main research channel: 73% of AI-using shoppers cite it as their primary source of product research, and 83% say they’re more likely to use AI for larger or more complex purchases (Adobe Analytics).
- AI-assisted buying may even reduce returns: 68% of shoppers say they’re less likely to return a product after using AI for the purchase – and online returns were down 1.2% year over year in the 2025 holiday season (Adobe Analytics).
Spending and Transaction Patterns

- The average spend per visit to an online store in 2024 was about $2.61, with the highest average in Health & Beauty ($3.02) and Home Appliances ($2.66) (Statista).
- The average online transaction contained about 4.95 items in 2024 (Statista).
- During the 2024 winter holiday shopping season, US online shoppers spent about $1.2 trillion, a 3% increase over 2023 (Investopedia / Salesforce).
- Inflation is changing consumer habits: 88% of shoppers have shifted their focus to better deals, 54% have switched to cheaper brands, 45% have postponed non-essential purchases, and 37% are actively using coupons and discount codes (Bazaarvoice, Shopper Preference Report 2025).
- Loyalty programs are part of that value-seeking: 32% of shoppers have joined a loyalty program specifically to access better deals (Bazaarvoice, Shopper Preference Report 2025).
- “Bracketing” has become standard practice: approximately 62% of shoppers purchase multiple sizes or variations of an item with the intention of returning the one that doesn’t fit – which inflates both the average order value and the return rate (Capital One Shopping).
- Social media is increasingly driving purchases: 32% of consumers say social media has introduced them to a new product, and 29% use it to compare prices and products (Bazaarvoice, Shopper Preference Report 2025).
Cart Abandonment: The Persistent Problem

- Around 70% of online shopping carts are abandoned before purchase. According to Baymard, based on 50 studies, the figure is 70.22% – and has remained above 68% for more than a decade. (Baymard Institute).
- A large part of abandonment is simply browsing: 43% of shoppers abandoned a cart because they were “just browsing / not ready to buy” (Baymard Institute).
- The top reasons for shopping cart abandonment are: too high extra costs – shipping, taxes, fees (39%), too slow shipping (21%), lack of trust in the website regarding card details (19%), the need to create an account (19%), and an overly long or complicated checkout process (18%) (Statista, 2025).
- Fixing this situation will come at a high cost: Baymard estimates that approximately $260 billion in lost orders is recoverable across US and EU e-commerce through a better checkout process alone (Baymard Institute).
- Abandonment rate varies by device: mobile has the highest rate at about 78%, followed by tablets (~69%) and desktops (~67%) – the smaller the screen, the higher the abandonment rate (Dynamic Yield, Feb 2025).
- By region, Asia-Pacific saw the most abandoned rate (~80%), followed by Europe/Middle East/Africa (~77%) and the Americas (~71%) (Dynamic Yield, Feb 2025).
- By product category, luxury and jewelry had the highest abandonment rate (~83%), while pet care and veterinary services had the lowest (~54%) (Dynamic Yield, Feb 2025).
Trust and the Purchase Process: What Makes Shoppers Leave

- 69% of US adults have abandoned an online transaction or sign-up because they didn’t trust the site (eMarketer / Liquid Web).
- 60% have entered fake personal information (a temporary email address or a fake name) when they felt a website was untrustworthy. (eMarketer / Liquid Web).
- Shoppers actively research brands before purchasing: 61% use Google Search to verify a brand’s credibility, 43% check Reddit, and 31% check the Better Business Bureau (eMarketer / Liquid Web).
- The fastest ways to lose trust: grammar or spelling errors on a website (73%), missing contact information (62%), and unclear privacy or data policies (59%) (eMarketer / Liquid Web).
- The situation comes amid real risks: internet crimes cost US consumers a record $16.6 billion in 2024, and 73% of US adults have experienced some kind of online fraud(Pew Research).
- On the flip side, reviews are the strongest trust factor: 52% of shoppers cite real customer reviews as the biggest factor in their final purchase decision (Bazaarvoice, Shopper Preference Report 2025).
- Trust signals work: 98% of consumers can identify at least one type of trust symbol (a star rating, review, or security badge), making them more likely to make a purchase (Trustpilot).
- But authenticity itself has become a crisis: 75% of shoppers are concerned about encountering fake reviews, and 97% say fake reviews make them lose trust in a brand (Bazaarvoice).
- Shoppers are wary of content that looks too good: 44% distrust reviews that are overly positive or generic, and 39% are suspicious of a spike in reviews over a short period (Bazaarvoice, Shopper Preference Report 2025).
Checkout Speed and Friction

Speed and ease of checkout are critical – customers come with certain expectations about how long it will take, and exceeding those expectations can have serious consequences.
- 80% of online shoppers will abandon a purchase if the checkout process is too complicated, and one in five will cancel if registration is required (Investopedia / Capterra).
- Shoppers expect checkout to be fast: 66% expect to complete it in 4 minutes or less, and 29% expect to finish in under 2 minutes (Capterra).
- Problems are often self-inflicted: the average checkout process in the US contains about 23.48 form elements by default, when the ideal process might be short, with only 12-14 elements (Baymard Institute).
- Better checkout design is one of the highest-return fixes in e-commerce: an average large site can gain roughly a 35.26% increase in conversion rate through checkout improvements alone (Baymard Institute).
- 76% of US consumers want to use their preferred payment method when shopping online, and many will abandon a purchase if that option isn’t available (Visa Acceptance 2025 Global Digital Shopping Index).
- Forter’s 2024 Trust Premium Report found 31% of consumers have abandoned carts specifically because of a complicated checkout process (Forter).
- Forcing account creation is a clear and preventable mistake: about 19% of shoppers abandon a purchase when required to create an account, so offering the option to checkout without registration is one of the most effective solutions (Baymard Institute).
Mobile, Delivery, and Payment Expectations

Where and how people shop keeps shifting toward mobile devices, fast delivery, and flexible payment options – and the expectations of major retailers are now being extended to everyone.
- Free shipping is the single most important delivery criterion for about 70% of US online shoppers, followed by fast shipping at 60% (Statista).
- Delivery speed is a real deciding factor: in a Digital Commerce 360 survey, 27% of shoppers abandoned an order because it wouldn’t arrive in time, 18% because delivery would be too slow, and 12% because the delivery date was unclear (Digital Commerce 360).
- Mobile now drives the majority of online shopping: about 59% of worldwide e-commerce sales came from mobile devices in 2025, projected to reach 63% by 2028 – which is exactly why the higher mobile abandonment rate matters so much (Capital One Shopping).
- Digital wallets have become the default online payment method, used for about 56% of global online purchases in 2025, with that share projected to continue to grow (Capital One Shopping).
- For many, online shopping has become a weekly habit: 49% of American consumers shop online at least once a week (Capital One Shopping).
The Post-Purchase Experience

- In the EU, 63% of online shoppers reported having no problems making purchases in 2025(Eurostat).
- Where problems did occur, the most common were slower than promised delivery (20%), followed by website usability issues (12%) and incorrect or damaged items (10%) (Eurostat).
- Returns are the defining post-purchase problem: US consumers returned an estimated $849.9 billion in merchandise in 2025 – about 15.8% of all retail sales (National Retail Federation).
- Online orders come back far more often than in-store ones: the e-commerce return rate is approximately 20% – about two to three times the in-store rate (National Retail Federation; Capital One Shopping).
- Speed also matters when returning an item: 76% of consumers are more likely to choose a return option that provides an instant refund or exchange (NRF & Happy Returns).
- Gen Z returns the most: shoppers aged 18–30 made an average of 7.7 online returns in the past 12 months – more than any other generation (NRF & Happy Returns).
- Returns are highly category dependent: in 2025, 26% of US consumers returned clothing bought online (the highest of any category), followed by footwear (18%) and accessories (13%) (Capital One Shopping).
- The main reason is sizing: size, fit and color account for approximately 45% of all retail returns (Capital One Shopping).
- A convenient return policy isn’t just an expense, it’s a factor in purchasing decisions: 82% of consumers say free returns are an important factor in deciding where to shop (NRF & Happy Returns).
- Refund speed builds loyalty: 85% of shoppers expect their refund within one week, though most refunds take 9-10 days to complete (Capital One Shopping).
- The risk of negative consequences is just as real: 71% of consumers are less likely to buy from the same retailer again after a bad return experience, compared to 67% in 2024 – and four in five say they will tell friends and family about it (NRF & Happy Returns).
- Return behavior has its own negative consequences: nearly two-thirds of consumers admit to at least one costly returns behavior (mixing items into one basket, changing clothes into another, sending back different items), and 45% believe that “distorting the truth” is acceptable when returning an item (NRF & Happy Returns).
What This Means For Your Online Business
Statistics are only useful when they help make a decision. A few practical considerations regarding the figures above:
The market is mature and growth is showing no signs of slowing – around 21% of all retail sales are now made online, and cross-border sales have become commonplace. The growth question has shifted from “Will people shop online?” to “Will they finish the purchase and trust you enough to come back?”.
The biggest and most easily resolved problem is the checkout process. With approximately 70% of carts abandoned, the most profitable option for most companies is not increased traffic, but a shorter, cleaner, and more reliable checkout process with transparent upfront costs.
Trust is now a conversion lever, not just a secondary value. When 69% of shoppers abandon a purchase due to mistrust, and most check your information on Google and Reddit before making a purchase, visible security, clear policies, real contact details, and a reputable presence beyond your own website directly translates to purchases.
We hope these insights help you shape and refine your online business growth plans.
Pitch Avatar turns presentations, PDFs, and videos into interactive content for sales, marketing, training, and support with AI Avatars, multilingual dubbing, voice cloning, per-slide engagement analytics, and HubSpot, Salesforce, Gmail, Outlook, and PowerPoint integrations. For e-commerce and marketing teams, this means scaling product and demand-generating video content across markets, personalizing engagement with larger audiences, and directly linking engagement data to lead scoring. If the e-shopper statistics above have you thinking about where AI video fits in your customer journey, start free or book a 15-minute demo.
About This Data
The statistics in this guide are obtained from primary and authoritative sources. Market size and adoption figures reflect 2026 data and projections; behavioral survey figures are shown for the latest published year (date given in the text), as the results from several key surveys are published with a one-year delay.
Primary and authoritative sources cited: eMarketer and Capital One Shopping (2026 market and adoption data), Eurostat (2025 EU ICT survey, ~330,000 individuals; next edition due 2027), the Baymard Institute (cart-abandonment meta-analysis of 50 studies), the US Census Bureau (US retail e-commerce share), Statista (checkout and delivery preferences), Adobe Analytics (AI-assisted shopping, based on 1+ trillion visits to US retail sites plus a 5,000-respondent consumer survey), Pew Research (online crime), and Investopedia/Salesforce (holiday shopping).
Additional research firms cited for specific figures, with the reporting intermediary noted inline in the text: Liquid Web (2025 State of Digital Trust), Dynamic Yield (2025 cart-abandonment benchmarks by device, region, and category), Capterra (checkout expectations), Forter (2024 Trust Premium Report), Digital Commerce 360 (delivery-timing abandonment), the National Retail Federation and Happy Returns (2025 Retail Returns Landscape report: 2,006 consumers + 358 e-commerce professionals), Trustpilot (trust signals), and Bazaarvoice (Shopper Preference Report and Shopper Experience Index 2025, 8,000+ global consumers; social proof and returns behavior).
We re-review this article quarterly to keep the data current. Last updated: July 2026.
Frequently Asked Questions
In 2026, approximately 2.86 billion people will shop online, representing approximately a third of the world’s population and an increase of approximately 3% from the previous year. E-commerce is projected to make up about 21% of all retail sales worldwide in 2026, and this figure will reach approximately 22.5% by 2028.
Around 70% of online shopping carts are abandoned before a purchase is made – the average across 50 Baymard Institute studies is 70.22%, and that rate has remained above 68% for more than a decade. This figure is significantly higher on mobile devices (~78%) than on desktop computers (~67%), and varies by region and product category.
A large part (43%) simply browse products and are not ready to buy. Among the avoidable reasons, extra costs such as shipping, taxes and fees are the leading ones (the top reason, cited by approximately 39-40%), followed by slow delivery, mistrust of the website regarding card details, the need to create an account, and an overly long or complicated checkout process.
Trust is now a direct conversion factor: 69% of US adults have abandoned a purchase because they didn’t trust a website. Shoppers actively research brands before purchasing (61% through Google search, 43% through Reddit), and the things that most quickly erode trust are spelling errors (73%), missing contact information (62%), and unclear privacy policies (59%).
Shoppers expect speed: 66% expect to complete checkout in 4 minutes or less, and 29% in under 2 minutes. Yet the average US checkout process contains around 23.5 form elements, while the ideal should only include 12-14 – closing this gap is one of the most effective solutions in e-commerce, estimated to increase conversions by 35%.
Free shipping is the single most important delivery criterion for about 70% of US online shoppers, followed by fast shipping at 60%. Delivery times are a real deciding factor: 29% of shoppers have abandoned an order because it won’t arrive on time.
AI has become an integral part of the shopping experience: 39% of consumers have used AI for online shopping, primarily for product research (55%), recommendations (47%), and finding great deals (43%) – and 85% say it has improved their experience. The traffic it attracts also converts: by March 2026, the conversion rate of visits to retail sites redirected through AI was 42% higher than through traditional channels, a complete reversal of the previous year’s figure. Among people aged 18-34, 41% now start their product searches in a generative AI tool instead of a search engine.