Every year, the Stanford Institute for Human-Centered AI (HAI) publishes the AI Index – the most comprehensive, independently verified overview of the state of AI. Most summaries of it read like a scientific digest. This one is written for those who will need to make practical decisions: what the 2026 data actually means for your implementation decisions, your hiring, your budget, and where AI is and isn’t ready to do real work. Every figure comes from that single, carefully crafted report, so you’re evaluating data, not marketing claims.
A note on the data: unlike most “state of AI” reviews, which combine vendor blogs and aggregator estimates, all data presented here is based on a single, authoritative source – Stanford HAI’s AI Index, whose stated mission is to provide “objective, rigorously verified, and broadly sourced data”. Figures are from the 2026 edition unless otherwise noted. If a number is a benchmark, a forecast, or taken from a previous edition, we indicate this.
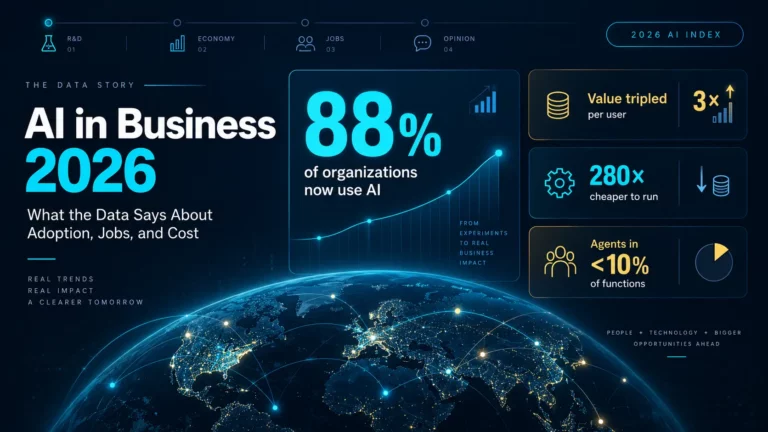
TL;DR: AI adoption is now near-ubiquitous (88% of organizations), the value it delivers has skyrocketed, while operating costs have plummeted (consumer surplus in the US has reached $172 billion annually, with the value per user tripling, and the cost of processing a GPT-3.5-level query has decreased 280-fold in two years), and the technology is actually changing some hiring processes – employment of software developers aged 22-25 will decline by nearly 20% from 2024, and one in three organizations expects AI to reduce their workforce this year. But the fully autonomous future is further off than the hype: AI agents are used in less than 10% of business functions, and on open-ended, end-to-end work they are still significantly inferior to humans. The key takeaway from the data is that reliable ROI is achieved not by replacing a team, but by enhancing its effectiveness with AI, and companies that are taking steps in this direction now, while the barrier to entry is virtually zero, are emerging as leaders.
Key AI Facts (2026 AI Index)
| Metric | Figure | Chapter |
|---|---|---|
| Industry share of notable frontier models | Over 90% | R&D |
| Global corporate AI investment (2025) | More than doubled | Economy |
| US vs China private AI investment | 23x more (US) | Economy |
| US consumer surplus from generative AI | $172B/year (early 2026) | Economy |
| Organizational AI adoption | 88% | Economy |
| Generative AI used in ?1 business function | 70% of organizations | Economy |
| AI agent implementation across business functions | Under 10% | Economy |
| Global AI compute capacity growth | 3.3x per year since 2022 | R&D |
| Nvidia share of global AI compute | Over 60% | R&D |
| US data centers | 5,427 (10x+ any other country) | R&D |
| FDA-authorized AI medical devices (2025) | 258 (1,357 cumulative) | Medicine |
| Employees using AI at work globally | 58% | Economy |
| AI skills in US job listings | 2.5% (+55% year over year) | Education |
| SWE-bench Verified coding leap | from 60% to ~100% of human baseline in a year | Technical Performance |
| Experts vs public who expect AI to improve jobs | 73% vs 23% | Public Opinion |
| Software developers aged 22-25 employment rate | Down nearly 20% | Economy |
| US consumer surplus from generative AI (early 2026) | $172B/year, up from $112B | Economy |
| Cost of a GPT-3.5-level query (2022-2024) | from $20 to $0.07 per million tokens (280x drop) | Economy (2025 Index) |
Who builds AI - And How Open Is It?

The dominance of the commercial sector has now become almost complete. In 2025, industry produced over 90% of notable frontier AI models, and this dominance was accompanied by less transparency: the officially reported number of model parameters remained close to 1 trillion for three years in a row, as leading labs largely stopped disclosing them.
The rivalry between the US and China in artificial intelligence is assessed using various metrics. In 2025, the US produced 59 notable AI models, while China produced 35. Nevertheless, China is creating more models overall and is quickly improving their quality; China’s percentage of the 100 most-cited AI papers increased from 33 in 2021 to 41 in 2024. The performance gap between the models has become minimal. As of March 2026, the top US model outperformed the top Chinese model by just 2.7%, and leadership switched back and forth several times throughout the year.
In this area, improving efficiency is becoming one of the priority areas. The OLMo 3.1 Think 32B model possesses nearly 90 times fewer parameters than Grok 4. It yields similar results on several benchmarks. This performance comes from pruning, deduplication, and careful data curation rather than large-scale computing.
The open-source ecosystem is still expanding. Projects on GitHub and Hugging Face have reached 5.6 million (with Hugging Face uploads having tripled since 2023), and US-based projects have received a combined 30 million GitHub stars. But the performance difference between open and closed models, which fell for a period in 2024, has risen again. The leading closed model now exceeds the leading open model by 3.3%, versus 0.5% in August 2024. And six of the top ten models on the Arena leaderboard are closed.
The Economics: Investment, Cost, and Consumer Value

Funding has changed dramatically. Global corporate AI investment more than doubled in 2025, with private investment growing fastest at 127.5% and now representing 60% of total AI funding. Generative AI is driving growth: private GenAI investment increased by more than 200%, taking about half of all private AI funding, while newly funded AI companies grew by 71% and billion-dollar funding rounds almost doubled.
In generative AI specifically, US investments have significantly exceeded the combined investments of China and Europe. Regionally, the US has invested 23 times more private funds in AI than China, although this figure understates China’s actual spending, as government-funded funds invested approximately $184 billion in Chinese AI companies between 2000 and 2023.
These models involve enormous infrastructure costs. Major cloud providers sharply increased capital spending, and Google alone reported more than $150 billion in annual capex in 2025. Since 2022, global AI compute capacity has grown 3.3x per year, reaching 17.1 million Nvidia H100-equivalents, and Nvidia now accounts for over 60% of that total capacity. The US hosts 5,427 data centers, more than ten times the number of such facilities in any other country.
Value returning to ordinary users is growing at a comparable rate. Estimated consumer value from generative AI grew 54% within a year, and US consumer surplus hit $172 billion per year by early 2026 (up from $112 billion), with the median value per user tripling, even though most of these tools remain free or nearly free.
The underlying trend is equally striking: in the previous (2025) edition of the AI Index, the cost of a GPT-3.5-level query dropping 280-fold, from $20 to $0.07 per million tokens, between the end of 2022 and the end of 2024. Combine these two factors (significantly reduced execution costs and significantly greater value in use), and you see that all factors are compounding in your favor. For most teams, AI implementation is no longer an expense requiring CFO approval; it’s closer to a coffee-budget experiment with huge profit potential.
How Capable Is AI Now - And Where Does It Still Fail?

Artificial intelligence capabilities are progressing faster than the tests created to evaluate them. On Humanity’s Last Exam (a benchmark designed to test AI while remaining attainable for human experts), leading models’ performance increased by 30 percentage points over a year. Over the same period, scores on the SWE-bench Verified benchmark (which assesses coding skills) rose from 60% to almost 100% of the level demonstrated by humans. Several frontier models now reach or exceed human performance on PhD-level science questions, mathematical competitions, and multimodal reasoning. At the same time, the best systems’ performance is converging: the four leading developers are within 25 Elo points of one another on the user-voted Arena leaderboard. This convergence is shifting competition toward cost and reliability rather than just performance.
The data below presents the current leaderboard (Arena Elo, as of March 2026):
| Developer | Arena Elo |
|---|---|
| Anthropic | 1,503 |
| xAI | 1,495 |
| 1,494 | |
| OpenAI | 1,481 |
| Alibaba | 1,449 |
| DeepSeek | 1,424 |
The report presents failures with the same clarity as successes. It contains a clear description of these issues:
- Benchmark results become unreliable. An analysis of widely used evaluations found invalid questions ranging from 2% (MMLU Math) up to a critical 42% (GSM8K), raising serious questions about what the leaderboards actually measure.
- Large language models still have difficulty distinguishing between beliefs and facts. In a new accuracy benchmark, hallucination rates across 26 leading models ranged from 22% to 94%.When these models had to separate objective facts from the user’s false beliefs, their performance dropped significantly. GPT-4o’s accuracy dropped from 98.2% to 64.4%. DeepSeek R1’s accuracy fell from over 90% to 14.4%.
- Autonomous scientific reasoning is still an unsolved problem. On the PaperArena benchmark, the highest‐performing AI agent scored 38.8% against a PhD-expert baseline of 83.5%. In other practical scientific tasks (such as bioinformatics, astrophysics replication, and Earth observation), frontier models scored between 17% and 33%. In these cases, most of the code generated by the models failed to execute.
The pattern is clear: artificial intelligence outperforms humans on specific, clearly defined tasks, yet it remains less capable than humans in broad, comprehensive reasoning.
Adoption, Agents and Enterprise Reality

AI adoption continues to grow. In 2025, 88% of the surveyed organizations reported using AI, and 70% reported using generative AI in at least one business function. The highest annual growth rates were recorded in China and Europe. Worldwide, 58% of employees use AI regularly in their work. In emerging economies like India, China, Nigeria, the UAE, Egypt, and Saudi Arabia, more than 80% of employees use AI.
An important caveat: the era of autonomous agents is still in its very early stages. AI agent adoption rate remains flat (less than 10%) across almost all business functions. While demand is high (with job postings that mention “agentic AI” rising by more than 280% in one year), actual implementation lags far behind the hype.
We focus on that gap at Pitch Avatar. Generative AI is currently used by seven out of ten organizations, yet agents have not been widely deployed. Currently, the most practical value comes from an approach based on human empowerment: presentations, documents, and scripts are transformed into interactive videos with multilingual AI avatars acting under human control. This approach is more effective than a fully autonomous system, as tests show it is not yet ready for this type of work. The report repeatedly demonstrates that AI is a powerful tool for enhancing human work, although it cannot yet replace it.
Management systems evolve as adoption grows. AI-specific leadership positions grew by 17% in 2025, and the share of businesses without a responsible AI policy fell from 24% to 11%. The main obstacles to responsible implementation are knowledge gaps (59%), budget constraints (48%), and regulatory uncertainty (41%). In terms of regulation, GDPR remains the most frequently cited influencing factor, although its impact dropped from 65% to 60%. AI-specific standards such as the ISO/IEC 42001 standard (36%) and the NIST AI Risk Management Framework (33%) are gaining importance. The proportion of organizations reporting no regulatory influence decreased from 17% to 12%.
Science and Medicine: From Pilots To Deployment

In 2025, artificial intelligence moved from laboratory demonstrations to becoming practical scientific tools. Astronomy has launched its first foundation model, AION-1 (with up to 3 billion parameters), which was trained on 120 terabytes of data covering more than 200 million celestial objects. In weather forecasting, the Aardvark Weather system executed a complete forecasting pipeline with a single machine learning model (it utilized only 10% of the input data required by older systems while still outperforming the US national GFS model). The FourCastNet 3 produces a 60‐day global forecast in less than four minutes.
Medicine displayed the greatest shift from pilot programs to broader adoption. AI systems that write notes during patient visits cut physicians’ documentation time by up to 83%, and doctors noted reduced burnout rates. Inside simulated electronic health records, the best performing multi-agent AI model reached a 69.7% task success rate on MedAgentBench. Regulatory approvals have also accelerated: the FDA authorized 258 AI-enabled medical devices in 2025 (a record for a single year), raising the total approvals to 1,357. Radiology accounted for 76.6% of all approved AI medical devices.
Education and Talent: A Shifting Pipeline

AI use is widespread among students, with 80% of US high school and college students now using it for schoolwork. Academic enrollment is changing in unexpected ways. Between 2024 and 2025, the number of students enrolled in general computer science programs at four-year universities in the United States decreased by 11%. At the same time, the number of graduates with specialized master’s degrees in artificial intelligence increased by 17%, and the number of new PhDs in AI increased by 22%. This increase in PhDs occurred within academia, unlike the previous ten years, when these graduates typically found employment in industry.
The job market is rapidly changing how it values skills. AI skills now appear in 2.5% of all US job listings, representing an increase of 55% compared to last year, 72% since 2022, and 297% over the past decade. Demand for skills related to “agent AI” has grown by more than 280% in one year.
Jobs: What the Data Actually Shows

No AI question is asked more often than “Is it going to take my job?”, and the 2026 Index provides the most grounded answer available, offering more nuance than pessimistic predictions or flippant dismissal.
The honest headline is that large-scale, economy-wide job losses have not appeared yet. Overall employment is still rising. But the early effects are real and concentrated at the edges, among the youngest workers in the most AI-exposed roles. Employment for software developers aged 22-25 has dropped almost 20% from its 2024 peak, while employment for older workers in the same roles has remained steady or increased. A pattern is observed across age groups: declines are seen among both young people and high-risk workers, though neither factor alone causes the decline.
Employers expect more change ahead. One in three organizations expects AI to reduce its workforce in the coming year, with the largest anticipated cuts in service operations, supply chain, and software engineering – though almost half expect little or no change.
The most useful insight for anyone making these decisions is the distinction between automation and augmentation. Where AI completely automates a task (such as writing standard code or handling routine support chats), demand for entry-level positions tends to decline. Where AI helps people, for example by solving problems or checking their work, employment levels remain stable or even increase. The main question is not whether to “implement AI or not”, it’s how you use it. Teams that use AI to upskill their employees achieve different results than teams that use it solely to cut costs.
Public Opinion: The Widening Gap Between Experts and Everyone Else

If the 2026 Index contains a single main finding, it isn’t about models or money – it’s about people. The report outlines an increasing gap between the views of AI experts and public opinion on the future of AI, and many news outlets highlighted this as the most important aspect.
Globally, optimism grew: the share of individuals who think AI’s benefits outweigh its risks climbed from 55% in 2024 to 59% in 2025. At the same time, anxiety rose to 52%. Thus, people are increasingly accepting AI, even despite growing concerns about it.
The biggest disparity in views exists between professionals in the field and the general public. When asked if AI will enhance work performance, 73% of experts expect a positive outcome, versus just 23% of the public – a gap of 50 percentage points. Similar differences are observed in other areas: 84% of experts view AI’s effect on medical care positively (while 44% of the public do); regarding the economy, 69% of experts are positive compared with 21% of the public. Only about 10% of Americans say they are more excited than worried about AI, whereas 56% of experts express the same opinion.
Trust in government AI regulation varies greatly across countries, and the US, despite being the world’s leading AI investor, demonstrates the lowest level of trust among all countries surveyed, at just 31% (Singapore leads with 81%). Globally, people trust the European Union to regulate AI more than the US or China.
Generational change may be the most important signal in the coming years. A 2026 Gallup survey showed that the share of Gen Z respondents who say they are excited about AI fell from 36% to 22% within a year, while those who feel angry rose from 22% to 31%, despite the fact that roughly half of Gen Z use AI weekly or daily. Additionally, illustrating the growing personalization of AI, experts predict that 10% of US adults will use an AI companion daily by 2027, rising to 30% by 2040.
Responsible AI: The Safety Gap
One statistic highlights the present tension between adopting technology and maintaining system stability. As adoption grew, the count of failures grew as well. The AI Incident Database recorded 362 AI-related incidents in 2025, compared with 233 in 2024. This rise indicates that safety evaluation methods are falling behind the pace of product releases.

What This Means For Your Team
Strip the 400 pages down to the points that should influence your decisions this quarter:
- The high cost argument is no longer relevant. Running a capable model became 280x cheaper in two years, and the value users extract from generative AI has tripled per person while the tools remained free or nearly free, so the claim “too expensive to try” no longer holds. Begin with a single high‐volume, well‐defined workflow instead of waiting for a perfect strategy.
- Implement AI to enhance functionality rather than solely for automation. The jobs data shows that automation and upskilling have different impacts, and it is in employee empowerment that the Index’s ROI evidence is most compelling.
- Don’t over‐invest in the “agent” story yet. Since AI agents are used in less than 10% of business processes and still fail at most open-ended tasks, their real value lies in narrower, human-controlled applications (such as content creation, support, training, and analytics) rather than full autonomy.
- Be mindful of the trust gap. Your customers and younger employees are more wary of AI than those who sell it (only 23% of the public expects AI to improve their work, versus 73% of experts). Transparency in AI use is becoming a matter of trust and customer retention, not merely an ethical issue.
In this context, we’re building Pitch Avatar: helping teams realize real, proven value from human-augmenting technologies (turning presentations, documents, and scripts into interactive, multilingual videos that are still controlled by a human) while the fully autonomous future is still shaping up.
About This Data
All statistics presented in this article come from one authoritative source: the 2026 AI Index Report from the Stanford Institute for Human-Centered AI (HAI), which states its mission is to provide “unbiased, rigorously verified data from a wide variety of sources”. The report consists of nine chapters (Research and Development, Technical Performance, Responsible AI, Economy, Science, Medicine, Education, Policy and Governance, and Public Opinion), and the figures presented here are arranged according to those themes. Public‐opinion figures come from surveys that the Index aggregates (such as those from Ipsos, Gallup, and Pew), and they are reported here exactly as the Index presents them. One figure, the 280‐fold drop in inference cost for a GPT-3.5‐level query, originates from the AI Index’s 2025 edition (which measures through late 2024) instead of the 2026 report, and it is labeled accordingly wherever it appears; it is included as directly relevant context on the cost of running AI. Benchmark scores, Elo ratings, and forward-looking estimates are point-in-time measures (many as of March 2026) and will change as new models are released; consider them as an overview rather than a final judgment. The full report and underlying data are freely available.
Curious how the enterprise-AI shift plays out in practice? See how Pitch Avatar turns this moment of adoption into working video content.
Frequently Asked Questions
It’s an annual report from the Stanford Institute for Human-Centered AI (HAI) that tracks, collates, and visualizes data on artificial intelligence – from research and technical performance to economics, adoption, safety, and policy. It’s independently prepared and widely regarded as the most comprehensive, least commercialized overview of the field. The 2026 edition is its tenth.
Global corporate AI investment more than doubled in 2025, with private investment growing 127.5% and generative AI alone attracting over 200% more private funding year over year. The US committed roughly 23 times more private AI investment than China.
AI is used very widely for basic applications, but far less for autonomous functions. 88% of surveyed organizations report using AI, and 70% use generative AI in at least one business function, but AI agent implementation remains under 10% across nearly all functions, and 58% of employees globally use AI at work.
It depends entirely on the task. On narrow benchmarks, frontier models are improving faster than the tests can keep up – gaining 30 points in a year on one of the hardest tests. But on open-ended, end-to-end reasoning, they still fall well short: the best AI agent scored 38.8% on a research benchmark where PhD experts scored 83.5%.
Opinion is warming and worrying at once: globally, 59% now say AI’s benefits outweigh its drawbacks (up from 55%), but 52% say AI products make them nervous. The most notable finding is the gap between experts and the public (73% of experts expect AI to improve how people work, versus just 23% of the public), and trust in government to regulate AI is lowest in the US (31%) of any country surveyed.
Not in total, overall employment is still rising, but the early effects are real in some areas. The number of employed software developers aged 22-25 has fallen by nearly 20% compared to 2024, and one in three organizations expects to see workforce reductions this year due to the impact of AI technologies. The clearest pattern is that automating tasks reduces the need for entry-level hiring, while empowering employees doesn’t, so how a company implements AI matters as much as whether it is used.
The complete 2026 AI Index is freely available at Stanford HAI, including the full PDF and public data.