Let’s start with a scenario familiar to many. Your team has spent a week (two weeks, a month – delete as applicable) creating the perfect video. The script sparkles with finely tuned phrasing, the lighting is so flawless it would make a 1950s film noir cinematographer jealous, and the performers speak like straight-A students who’ve taken an acting masterclass. Everything that should be shown is shown, everything that was supposed to work worked without a hitch, and the editing is as dynamic as in a Hollywood teaser.
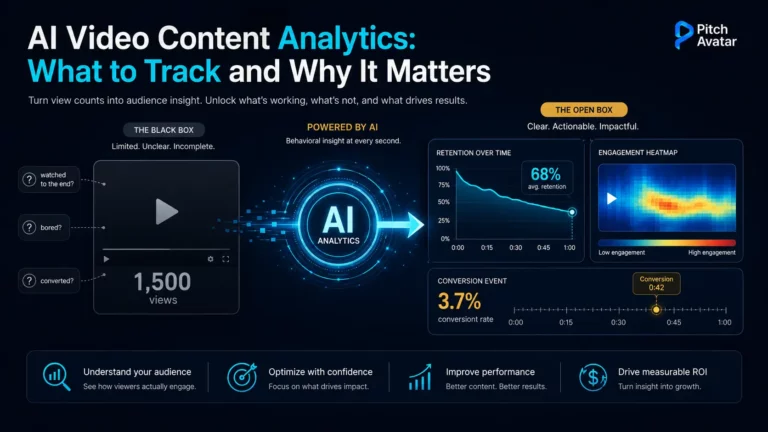
You hit “Publish”, sit back in your chair, and wait for the world to fall at your feet. Three days later… the video has 1,500 views. Is that a lot or a little? Did it hook the audience’s attention or not? Did people watch to the end, or close it halfway? If they closed it, then why? Or did they just pause and watch it later?
The desire to look inside the “black box” of viewer reactions is common to all video content creators – especially commercial companies. And the reason why this is important for the latter is easily explained. Today, when more video content is produced than humanity can physically consume, businesses can’t afford to guess. They need to find video analytics tools that provide accurate and detailed answers.
Fortunately, thanks to advances in AI, solutions of this kind have become much smarter. Contrary to cyberpunk predictions, it turns out artificial intelligence isn’t interested in enslaving humanity – its main passion is numbers. Today, AI viewer tracking isn’t just about counting clicks. It’s a chance to read your audience’s reactions: where they get bored, where they laugh, and where they’re ready to pull out their credit cards.
Let’s break down the key content performance metrics and see why analyzing data with AI has become a must have tool for any video content creator.
The End of the Vanity Metrics Era
For a long time, creators of commercial videos prayed to views and likes. PR specialists, advertisers, and marketers joyfully reported: “Boss, we have a million views!”. But what was hidden behind that million? An autoplay in a social feed while a user scrolled past? A five-second blank stare on YouTube?

The scale of adoption is real: about 91% of businesses use video as a marketing tool. But adoption isn’t the same as insight – and that’s the gap. A simple view counter is a vanity metric. It flatters the ego, but it doesn’t help you sell, educate, or inform. The teams getting real ROI from video are the ones that go beyond view counts and understand what viewers actually do.
Most teams’ performance measurement habits show how early it is to talk about such changes. When asked which way to measure video performance they consider most important, 67% of marketers cite views, followed by engagement (63%) and leads or clicks (52%) (Wyzowl 2026). Views still lead – but it’s engagement and leads that drive revenue from videos, and their popularity is growing. Social engagement in particular is the fastest-growing success metric, now the top metric for nearly a quarter of teams (22%), almost double its share the year before (Wistia State of Video 2026).
AI analytics work differently than a view counter. It collects data on user activity in videos and transforms it into understandable and useful information for decision making.
What to Track: Anatomy of Viewer Attention
Let’s break down the metrics algorithms track today and see how each one works in practice.

1. Viewer retention and drop-off points
This is perhaps the most honest metric in content. The audience retention graph shows not only the fact of viewing, but also the exact time when the audience stopped viewing it. AI doesn’t just record the fact – it helps analyze the context, answering the question “Why?”.
How it looks in practice: Say you posted a landscape-painting masterclass to promote a brand of dry pastels. Right at the beginning, accompanied by meditative music, you show pastels being removed from branded packaging, believing that this will strengthen the brand in the viewers’ minds. But the retention graph shows, with astonishing accuracy, that 60% of viewers stopped watching video after fifteen seconds. The point is clear: in this niche, the audience wants to experience a real, informative process from the first frames. They won’t watch a drawn-out demonstration of obvious branding.
This matches what decades of UX research would predict. Fundamental research into online user behavior conducted by the Nielsen Norman Group has shown that users rarely consume content with full attention – in one landmark study, 79% of users always scanned a new page while only 16% read the text word by word. People look for value by looking for themes, concepts, and frames that catch them, and they leave when a video doesn’t offer those hooks often enough. AI analytics detects these blind spots in viewers’ attention with near-perfect accuracy.
2. Engagement by section
Have you ever wondered why a viewer fast-forwards through some parts of a video while rewatching others several times? AI analytics generates heatmaps (heatmaps) of your content, highlighting “hot” and “cold” zones, clearly demonstrating what in your video actually hooks the audience and what does not.
How it looks in practice: Imagine you’ve released a detailed video review of a new product – say, a complex B2B platform or a SaaS. The AI draws a heatmap, and you see that potential clients mercilessly skip the beautiful one-minute intro from the CEO about your company’s mission – it’s a true “cold zone”. On the other hand, the part at 4:15, where you show automatic report exporting in one click, literally “glowing red”. People return to this 20-second piece again and again.
This is a priceless marketing insight: this exact feature is your audience’s main pain point and a sales driver. This means it should be used in the headlines of your landing pages, in short videos for targeted advertising, and in the bulletins you give to your sales team.
3. Click-through rate and interactivity
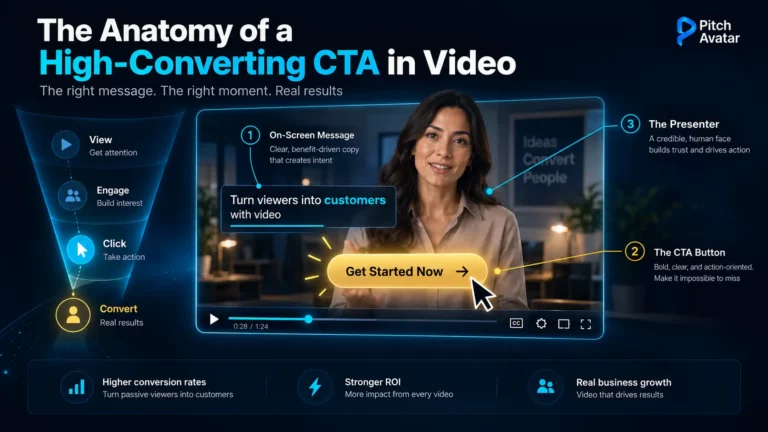
We’re used to thinking of video as a linear, passive process – you sit and simply watch. But modern formats can (and should) contain embedded links, lead forms, and CTA buttons. AI tracks how organically these elements are woven into the narrative and helps find the optimal timing for them.
How it looks in practice: Say you created a promotional video for your logistics automation service and added an interactive button right in the player: “Sign up for a free audit” or “Get a discount code”.
Place the button near the end, where only the most persistent 10-15% of users reach it, and your CTR will be unsatisfactory. If you place it in the first few seconds, people won’t yet understand the value of the product – they’ll close it like an annoying ad.
AI algorithms analyze the retention curve and find the balance. The system might detect that at the 2:15 mark, immediately after a case study demonstrating how your software reduced a client’s costs, engagement peaks at 85%. It can effectively prompt you: place an interactive link here – the viewer is interested, but not yet tired. As a result, you get real leads instead of beautiful but useless view statistics. This is important because interactivity is one of the strongest engagement levers in B2B content (short-form and interactive formats now rank as the top ROI content types) and AI is what tells you where to place the interactive moments for maximum impact.
Beyond the Big Three: Seven More Metrics for Your Dashboard
Audience retention, section engagement, and conversion rate are key metrics for in-depth analysis. But a complete video analytics picture (the one that turns content into a system) tracks at least ten metrics. Here are the other seven, and what each one actually tells you.

4. Play rate
The percentage of people who saw your video (thumbnail, embedded video, email link) and actually clicked play. Low play rates are not a content problem, it’s a design problem: the thumbnail, title, placement, or promise are not attracting attention. Fix play rate before you worry about anything that happens after the first second.
5. Completion rate and average percentage viewed
How many videos do people actually watch? The data is sobering: 65% of viewers watch a video to the end if it is less than 1 minute long, and only 20% watch videos longer than 20 minutes to the end. Track your watch time based on video length and let data, not habit, drive your viewing time.
6. Watch time and average view duration
Total minutes spent watching and average value per viewer. Completion rate tells you the percentage; watch time tells you the absolute attention you captured. For platform algorithms and for comparing a 90-second demo against a 10-minute webinar, this is a fairer assessment.
7. Re-watch rate
Which sections do viewers rewind and replay? A replayed fragment means one of two things: it’s your most valuable content (show it everywhere) or it’s confusing (viewers needed two viewings to understand it). Surrounding context (did they watch the video to the end or did they leave?) will tell you what exactly is happening.
8. Conversion rate
The percentage of viewers who completed the action the video was created for: booked a demo, filled out a form, started a trial period. This is the metric that connects video to revenue, and it’s the one that should be reported to management – all metrics above it are diagnostic.
9. Per-viewer engagement
Aggregated data hides the most important signal for B2B teams: who exactly watched the video. Individual-level tracking (“This prospect viewed 80% and watched the pricing information twice; that one skipped the intro part”) turns analytics into sales information. It’s the difference between “our demo performs well” and “call that prospect today”. Platforms built for B2B consider this as the primary unit of analysis.
10. Traffic source and device breakdown
Where viewers come from (email, LinkedIn, your site, a partner page) and what devices they watch videos on. The same video can hold attention from email and lose interest from social media, and mobile users are especially vulnerable to long intros and unreadable text. Source and device data will tell you where to distribute the video and how to format it.
One more to monitor: social engagement (shares, comments, reactions) – which, as noted above, is the fastest-growing success metric in the industry (Wistia, 2026). It’s noisy as a quality signal, but it’s the metric that measures whether your video is being shared without having to pay for each view.
Real-time Optimization: How AI Works
One of the key advantages of AI analytics is that it can work in real time.
A good example is training video optimization. This is a common problem in the corporate world: employees often watch mandatory training (on safety, corporate culture, ethics) in the background while doing other things or going for coffee.

Platforms with AI content generation help with exactly this. For example, Pitch Avatar, which specializes in creating interactive videos with AI avatars. It can be used to transform a traditional slide presentation into modern video content with an avatar presenter, and the analytics track viewer behavior during playback. It knows which slides, fragments, or interactive elements a viewers skipped and which ones they stayed on.
So, with Pitch Avatar, you can quickly create localized training courses and also collect interaction statistics. If the algorithm detects that in a certain module employees systematically skip the key parts (they don’t interact with interactive elements, or don’t pause to study a diagram), the HR team can act – holding a 1:1 meeting or editing the material to make it more engaging.
Why This Matters Right Now
In today’s information space, you compete not only with other companies. Your real competitors are the constant notifications from messengers and social apps, the funny cat memes, the reels and shorts friends send (which you absolutely must react to, or they’ll be offended), video messages from relatives, and everything else pulling at the viewer’s attention every second.
Using AI analytics for video content gives you several critical advantages:
- Budget savings. You stop making content that no one watches based on guesswork and only invest in formats that resonate.
- Personalization. By understanding how different audience segments interact with a video, you can adapt the message for each group.
- Predictive analysis. With enough accumulated data, AI models can begin to predict the success of a future video even at the scriptwriting stage, based on historical patterns.
AI won’t write a brilliant script for you (though its language models try hard), and it won’t add your charisma to the frame. But it can act as an effective intermediary between the creator and the audience.
AI can also respond dynamically to the data. Pitch Avatar can instantly notify a live manager if an important viewer starts to lose interest or tries to ask a question in the chat – so a human can join and take the initiative. And based on analytics, you can decide when to use a Chat-Avatar instead of a regular avatar for direct interactive conversation. Interactivity is a virtually universal key to capturing a potential customer’s attention, and it is AI’s ability to read a viewer’s reaction that makes this interactivity intelligent.
By tracking viewer retention, analyzing engagement heatmaps, and helping optimize content in real time, AI turns video creation from an art based on intuition into something much closer to an exact science. If you’re still looking only at the number of views, it may be time to update your approach – you’ll learn a lot of new, sometimes unexpected things about your viewers and your content.
Frequently Asked Questions (FAQ)
AI video analytics is the use of machine learning to track and interpret how viewers actually behave in videos: where they leave the video, which sections they replay, when they click on links, and whether they convert. Unlike a basic view counter, it turns viewing data into decisions: what to cut, where to place a call to action, and what content to create more often.
Three key metrics worth analyzing in depth are user retention and drop-off points, engagement by section (heatmaps), and click-through/interactivity time. Other metrics complete the picture: play rate, completion rate, watch time, replay rate, conversion rate, engagement per viewer, and traffic distribution across sources and devices. View count alone is a vanity metric.
Because the number of views says nothing about what happened after them. A million views might be a million autoplays scrolled through in a social feed or five-second glances on YouTube. Only 67% of marketers still lead with views as their primary metric, while engagement (63%) and leads or clicks (52%) are what actually connect video to revenue.
It depends a lot on the duration. Instead of chasing a single metric, track view completion based on video duration and let the data dictate your watch time – a high completion rate for a 30-second video and a low completion rate for a 15-minute webinar can be signals worth paying attention to.
AI analytics can monitor viewer behavior during playback, not just after. In a training context, it can detect which slides or interactive elements employees are skipping and flag instances of disengagement as they occur, allowing HR to take action or edit the module.
Retention measures how far viewers continue to watch – the drop-off curve showing exactly when attention is lost. Engagement measures how they interact with the content they view – which sections they replay, skip, and clicks, shares, and comments. Retention tells you where you’re losing people and engagement tells you what’s working and what can be reused.
With enough accumulated data, yes – to a certain extent. AI models trained on your historical viewing patterns can begin estimating a new video’s likely performance at the scripting stage, before you invest in production. It won’t replace expert review, but it will allow you to optimize the process earlier, addressing weak points before publication.